
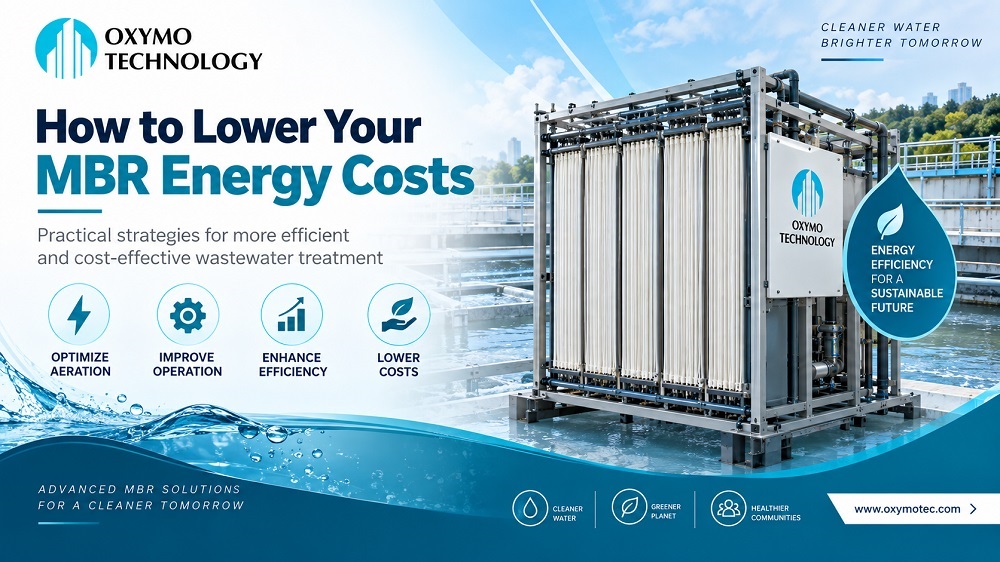
How to Lower Your MBR Energy Costs
An MBR plant can make high-quality treated water, but high energy use can raise costs fast. The good news is that big savings often come from making current equipment work better. You may not need to replace the whole system.
The main power loads in an MBR plant are air supply, membrane air scour, pumps, and fouling control. A 2022 review of full-scale MBR plants found that they used about 0.4 to 3.0 kWh of power for each cubic meter of water treated. That is a wide range. These differences come down to factors such as plant design, flow changes, and air control.
Power consumption can vary considerably, so please refer to your plant data first. Don’t assume that savings targets from other plants will apply to your own.
This guide shows where MBR plants use energy, which changes can lead to real savings, and what to ask a supplier before signing a contract.
Where Does Most MBR Energy Go?
Determine where the electricity goes before you try to save it. In most aerobic MBR plants, aeration uses the most energy. The plant needs air for two jobs: to help break down waste and to clean the membrane surface. Pumps, backwash, and cleaning consume power, but usually less.
- Biological aeration: adds oxygen so microbes can break down waste.
- Membrane air scouring: sends air across the membrane to help stop solids from building up.
- Permeate pumps: move clean water through and out of the membrane system.
- Sludge and recycle pumps: move water and sludge through the treatment zones.
Since aeration often uses the most power, small cuts in airflow can lower costs. But do not cut air without care. Too little air can lead to fouling or poor treatment.
Reduce Aeration Without Losing Treatment Performance
Cutting air without a plan can cause problems. It may lead to more fouling, too little oxygen for the biology, or poor nutrient removal. The goal is not simply to use less air. The goal is to use the right amount of air for the plant’s needs.
Practical steps include:
- Installing variable frequency drives (VFDs) so blower output can rise or fall with demand instead of running at one set rate all day.
- Setting dissolved oxygen (DO) targets based on the actual load, rather than using one high setting at all times.
- Using intermittent membrane aeration when plant conditions allow it. This means turning scour air on and off instead of running it all the time.
- Checking diffuser condition. Poor air spread can make blowers work harder to reach the same DO level.
A full-scale study cited in recent MBR energy reviews found that demand-based aeration control cut air use while keeping membrane performance steady. Results will differ from plant to plant. Use this finding as a guide, not a promise. Then check your own DO, TMP, and effluent data to confirm the results.
Control Membrane Fouling Before It Raises Energy Demand
Fouling creates resistance on the membrane surface. As permeability drops, operators may respond by increasing pressure, airflow, or cleaning frequency. Each step adds to operating costs. Excessive aeration can also damage sludge flocs and create more foulant, which may make fouling worse.
A practical fouling control program should include:
- Track transmembrane pressure (TMP): Monitor TMP trends over time instead of waiting for a clear drop in performance.
- Maintain a sustainable flux: Keep flux within the recommended range for your membrane type instead of pushing the system toward its maximum capacity.
- Maintain effective pretreatment: Hair, fibers, grit, and coarse solids can contribute to fouling if they are not removed early.
- Clean based on performance: Use TMP rise, permeability loss, and other operating trends to plan cleaning rather than relying only on a fixed schedule.
Before increasing blower output to control fouling, check whether excessive aeration could be contributing to the problem. Finding the root cause can reduce energy use while keeping membrane performance stable.
Improve Blower and Pump Efficiency
Blowers and pumps often run for many hours. Even small gains in how well they work can save a lot of power over a year. Check these key areas:
- Match flow to equipment size: Large blowers and pumps may waste power when they run at low load. Make sure the size of the equipment fits the plant’s real flow needs.
- Use speed control: Variable speed drives let the equipment slow down or speed up as demand changes during the day and year.
- Reduce pressure loss: Check pipes, diffusers, valves, and air lines for parts that block or slow the flow. High pressure loss makes blowers work harder to move air.
- Check low-flow use: Make sure the equipment can run well at low flow. Most MBR plants run below full load for much of the year.
You may not need new equipment to cut power use. Better sizing, control, and regular checks can often improve the system you have.
Use Smarter Filtration and Cleaning Cycles
Filtration and cleaning settings that never change can waste power when wastewater flow and quality shift during the day or year. When you can, set filter, rest, backwash, and air cycles using live TMP and flow data. This works better than using the same set plan all the time.
Review the cleaning plan often. Too much use of cleaning chemicals costs more and can wear out the membranes. But if you wait too long, dirt can build up. The system may then need more power to keep the right flow rate.
A plan based on the state of the membranes can work better than one based on set dates. Make changes in small steps. Track TMP, flow, and water quality as you do. This will show if the new plan cuts power use while keeping the same level of water treatment.
Measure Energy Before and After Every Change
Looking only at the monthly electricity bill makes it difficult to see which changes are saving energy. A better approach is to track specific energy consumption, or electricity used per cubic meter of treated water. Break the data down by system where possible.
Key metrics to track include:
- Daily and specific energy use: Record total electricity use per day and per cubic meter of treated water.
- Blower energy use: Track blower electricity as a share of total plant consumption.
- Pumping energy: Measure energy used by permeate, sludge, and recycle pumps separately.
- Membrane performance: Track TMP and permeability trends alongside any changes in aeration.
Published full-scale studies show energy use below 0.5 kWh per cubic meter in some plants and several kWh per cubic meter in others. This wide range shows why one set target may not fit every MBR plant.
Use these figures as a guide, not as a promise. First, measure your plant’s normal energy use. Then make one change at a time and check the results. This will show if the change saves power while keeping water treatment on track.
What Should You Ask an MBR Supplier?
Energy performance is largely locked in at the design stage, so it’s worth raising these questions before signing a contract:
- What specific energy consumption is expected at average and peak flow?
- How is blower energy split between biological aeration and membrane scouring?
- Can blower speed adjust automatically as flow and load change?
- How does the design handle fouling during low-flow and high-load periods?
- What cleaning frequency is assumed in the supplier’s operating cost estimate?
- What performance data can the supplier share from comparable operating plants?
A lower purchase price can turn out to be more expensive over the life of the plant if the system requires excessive aeration to hit its treatment targets.
Build a Long-Term Energy Reduction Plan
Energy optimization works best as an ongoing process rather than a one-time change. Plant conditions can change as wastewater strength, temperature, flow, and membrane condition vary. As these conditions shift, energy use can change too.
A simple five-step framework can help:
- Set a baseline: Record flow, TMP, airflow, energy use, and effluent quality before making any changes.
- Find the biggest energy users: Identify which equipment uses the most power. Then check whether it needs to run at its current level.
- Test one change at a time: Make small adjustments to the controls and watch treatment performance closely.
- Compare the results: Look at energy savings along with fouling, cleaning needs, maintenance, and effluent quality.
- Keep what works: Standardize successful changes and review them regularly using current operating data.
This step-by-step approach helps prevent short-term savings from causing fouling, compliance, or maintenance problems later. It also gives operators a clear, practical way to improve energy performance over time.
Why Partner With Oxymo Technology
Every treatment plant is different. General tips may not fix the real issues in your system.
Oxymo Technology works with industrial and city clients to find where energy is being wasted. Our team checks air use, membrane health, and the full system before we suggest any changes. We focus on plans that work with your current setup and budget. We do not sell one plan for every plant.
Oxymo Technology has helped business clients cut costs while keeping water quality high. We use proven methods and give clear steps that are easy to put in place. We do not suggest costly upgrades or unnecessary changes that your plant does not need.
Final Thoughts
Lowering energy costs does not take guesswork or luck. It starts with finding where energy is wasted and fixing each issue step by step.
Better aeration control, good fouling control, and smart automation can lead to real savings. These steps can lower your power bill while keeping water quality and permit limits on track.
Your plant does not need to pay avoidable energy costs each month. Oxymo Technology can review your current system and find ways to save within a few weeks. Contact Oxymo Technology today to book a free energy check for your plant. Start cutting MBR energy costs before your next power bill arrives.
FAQs
How much energy does a typical MBR system use for aeration?
Most MBR systems use about 0.4 to 3.0 kWh of energy per cubic meter of water. The exact amount depends on the plant design, water flow, membrane setup, and control system. Data from the plant itself gives the best guide.
Which part of an MBR plant uses the most energy?
Aeration often uses the most energy. It supplies air for the treatment process and helps clean the membranes.
Can aeration be reduced without harming treatment?
Yes, if you lower the airflow with care. Use DO or ammonia readings to guide each change. Then check the water quality and TMP to make sure the plant still works well.
Does membrane fouling raise energy use?
Yes. Fouling makes it harder to push water through the membranes. The plant may then need more air, pressure, or cleaning. Good fouling control can cut both energy use and upkeep costs.
What is the safest way to cut MBR energy costs?
First, measure how much energy the plant uses for each cubic meter of water. Next, check the air system, fouling control, pumps, and blowers. Change one thing at a time, and track the results.